

Grafana is open source visualization and analytics software. It allows you to query, visualize, alert on, and explore your metrics no matter where they are stored. In plain English, it provides you with tools to turn your time-series database (TSDB) data into beautiful graphs and visualizations.
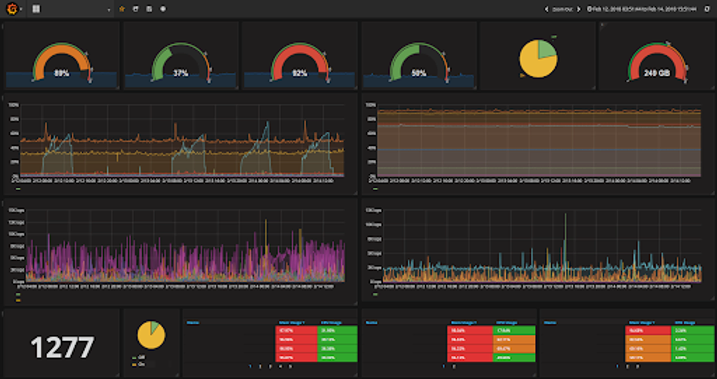
After creating a dashboard like below, there are many possible things you might do next. It all depends on your needs and your use case.

Configure And Install Grafana on centos
Step 1- Download and Install Grafana
I am installing Grafana from a YUM repository . You can install it manually using YUM, manually using RPM, or by downloading a binary .tar.gz file,Grafana download page.
Add a new file to your YUM repo using the method of your choice
sudo vi /etc/yum.repos.d/grafana.repo
Step 2- Copy and paste the below parameters in /etc/yum.repos.d/grafana.repo
[grafana]
name=grafana
baseurl=https://packages.grafana.com/enterprise/rpm
repo_gpgcheck=1
enabled=1
gpgcheck=1
gpgkey=https://packages.grafana.com/gpg.key
sslverify=1
sslcacert=/etc/pki/tls/certs/ca-bundle.crt
save and exit
Step 3- Install Grafana
sudo yum install grafana-enterprise
Step 4- Start the server and configure grafana server on boot.
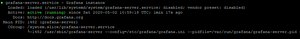
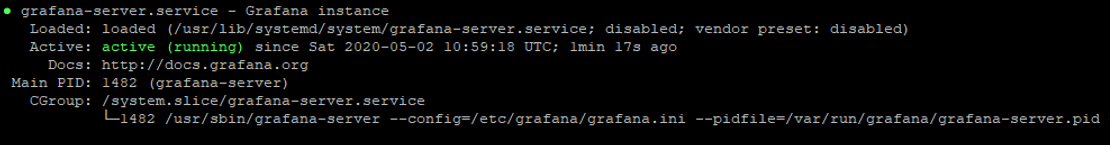
sudo systemctl daemon-reload
sudo systemctl start grafana-server
sudo systemctl status grafana-server
sudo systemctl enable grafana-server.service
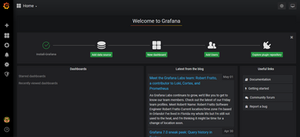
Step 5- Access it using UI
Now you will be able to access the Grafana on 3000 port . Make sure that port 3000 is open for web interface
http://<grafana_IP>:3000


The default user/password for Grafana is admin/admin.You will be prompted to change the default password.
Add Prometheus Data Source In Grafana
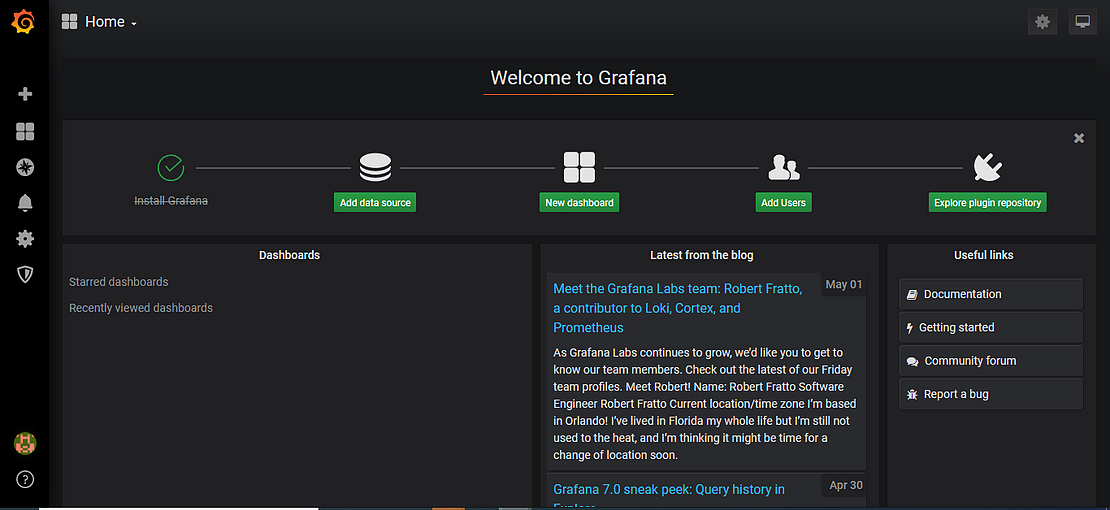
After successful login, we are now at the main screen of Grafana Web UI.
Step 1- Click the add source option from the Grafana homepage.

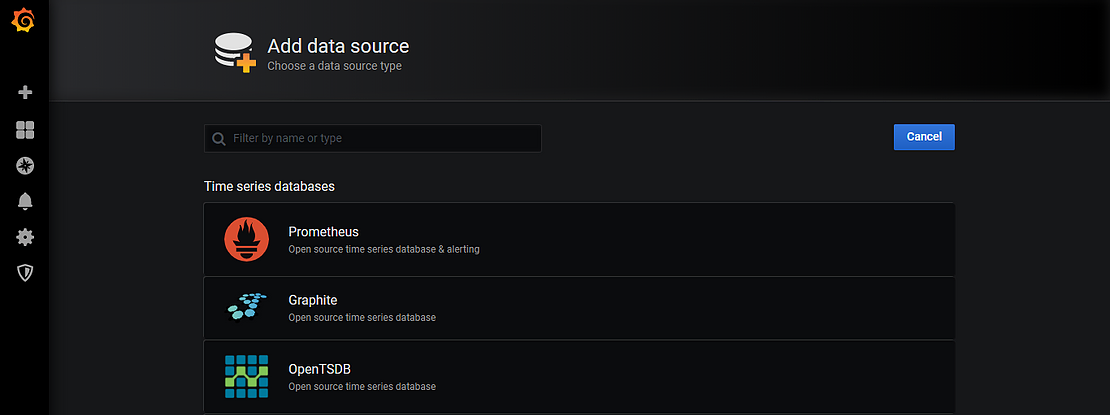
Step 2- Click on Prometheus
URL http://<prometheusip:9090>
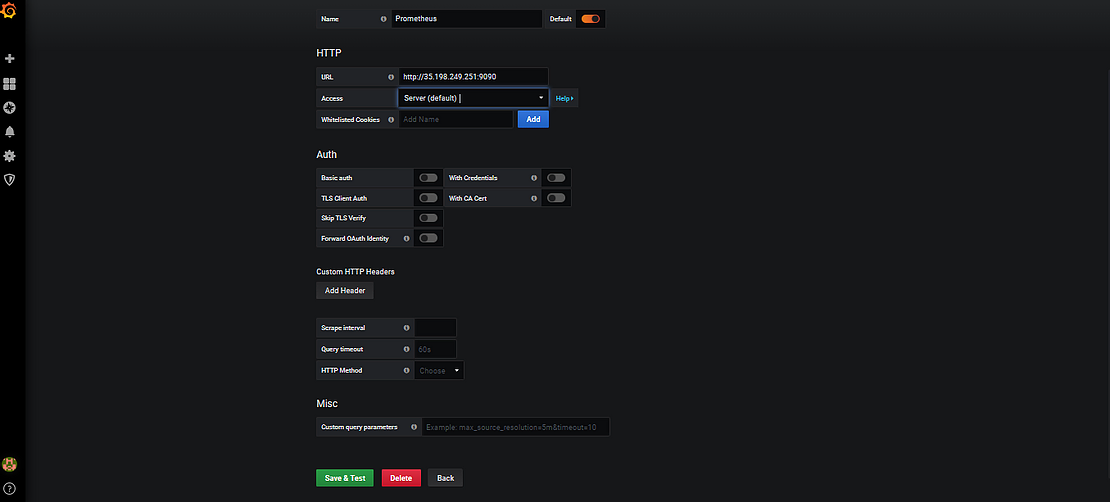
Step 3– Click on Save & Test

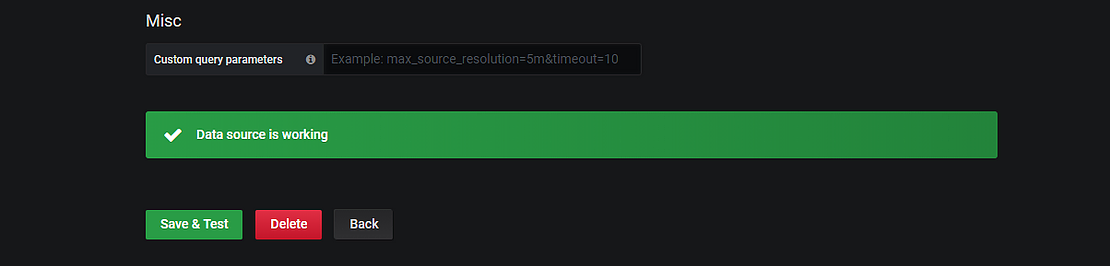
if it is not work then you should check your Prometheus service if it is running or not.
Create Prometheus Dashboard In Grafana
You can use the default dashboard for Prometheus or you can import a new dashboard
For Memory, CPU, Disk i am importing a new dashboard
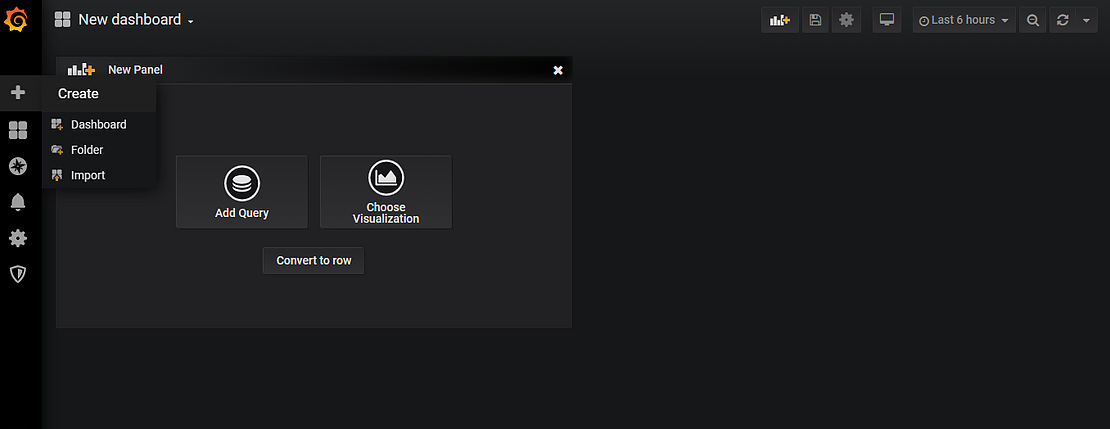
Step 1- Click on + sign and click import
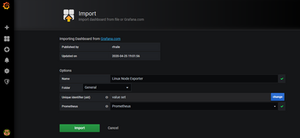
Step 2- Add the id 1860 in Paste Grafana.com dashboard url of id and load


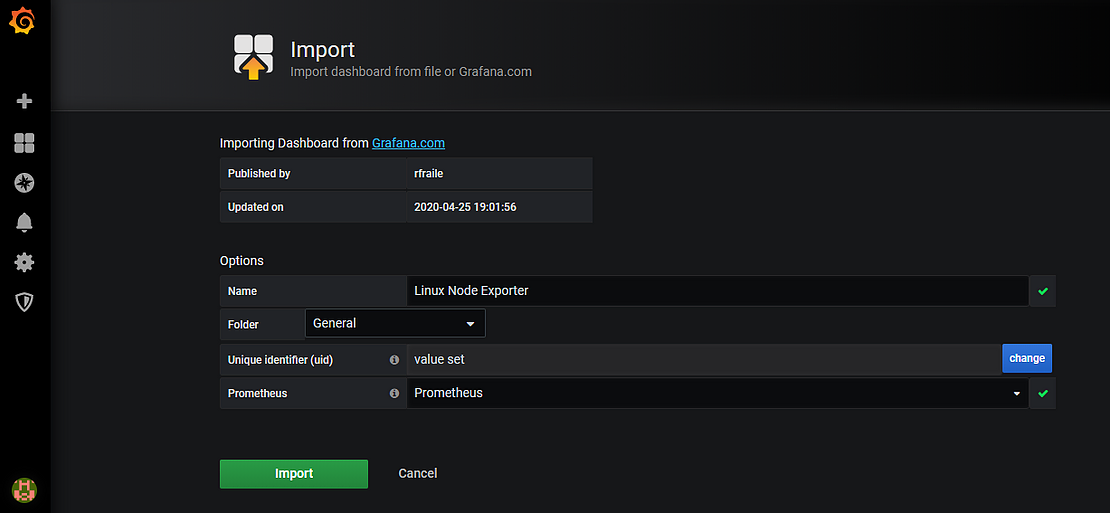
Step 3- Add the desire name , folder and at last select Prometheus.
click Import
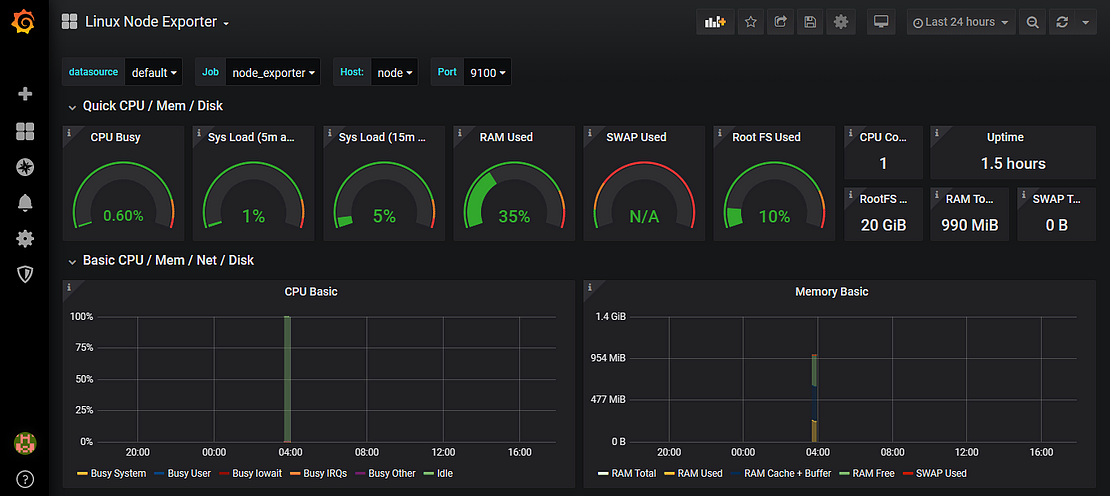
Now the dashboard is Imported like this:-
Kudos... You installed and configured Grafana ,added the Prometheus data source and dashboard is also created .