
In my previous blogs, I posted some of the basic infrastructure and log monitoring techniques to monitor our infrastructure and gathering logs from the servers using Grafana and Prometheus.
In this blog , i will show you how can we monitor our java applications using special type of Prometheus Exporter known as JMX(Java Management Extension) Exporter.
The Prometheus JMX exporter exposes a Java application’s JMX objects in a way that is friendly for Prometheus to consume.
Steps to follow:
- Download and Run java agent jar.
- Configure the yml file for application.
- Add JVM parameter to application file.
- Adding the server parameters in the Prometheus.yml file
- Import Jmx dashboard in grafana
Step 1:- Download and Run java agent jar.
JMX to Prometheus exporter: a collector that can configurably scrape and expose mBeans of a JMX target.
This exporter is intended to be run as a Java Agent, exposing a HTTP server and serving metrics of the local JVM. It can be also run as an independent HTTP server and scrape remote JMX targets.
To download the native JMX Java Agent ,from here.

java -javaagent:./jmx_prometheus_javaagent-0.13.0.jar=19080:config.yaml -jar yourJarname.jarNote:- You can change the port according to your requirement
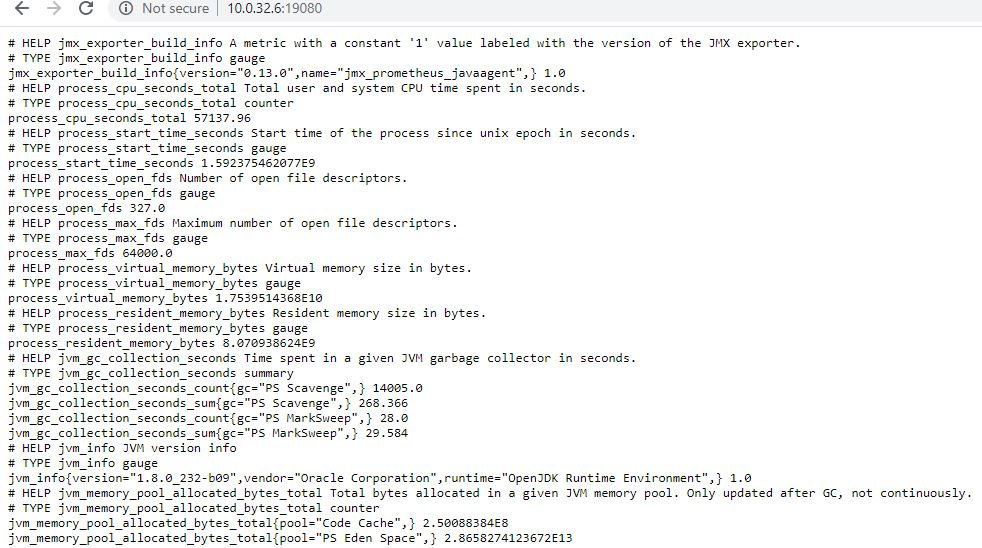
Note:– You can access the below metric when we add the parameters in ,setenv.sh file and restart the application
Access the mertic at http://ip_address:19080
Step 2:- Configure the yml file for application.
Create a file tomcat.yml in a directory where jmx.jar is present
copy the below yml in tomcat.yaml:
---
lowercaseOutputLabelNames: true
lowercaseOutputName: true
rules:
- pattern: 'Catalina<type=GlobalRequestProcessor, name="(w+-w+)-(d+)"><>(w+):'
  name: tomcat_$3_total
  labels:
    port: "$2"
    protocol: "$1"
  help: Tomcat global $3
  type: COUNTER
- pattern: 'Catalina<j2eeType=Servlet, WebModule=//([-a-zA-Z0-9+&@#/%?=~_|!:.,;]*[-a-zA-Z0-9+&@#/%=~_|]), name=([-a-zA-Z0-9+/$%~_-|!.]*), J2EEApplication=none, J2EEServer=none><>(requestCount|maxTime|processingTime|errorCount):'
  name: tomcat_servlet_$3_total
  labels:
    module: "$1"
    servlet: "$2"
  help: Tomcat servlet $3 total
  type: COUNTER
- pattern: 'Catalina<type=ThreadPool, name="(w+-w+)-(d+)"><>(currentThreadCount|currentThreadsBusy|keepAliveCount|pollerThreadCount|connectionCount):'
  name: tomcat_threadpool_$3
  labels:
    port: "$2"
    protocol: "$1"
  help: Tomcat threadpool $3
  type: GAUGE
- pattern: 'Catalina<type=Manager, host=([-a-zA-Z0-9+&@#/%?=~_|!:.,;]*[-a-zA-Z0-9+&@#/%=~_|]), context=([-a-zA-Z0-9+/$%~_-|!.]*)><>(processingTime|sessionCounter|rejectedSessions|expiredSessions):'
  name: tomcat_session_$3_total
  labels:
    context: "$2"
    host: "$1"
  help: Tomcat session $3 total
  type: COUNTER
save and exit
Step 3:- Add JVM parameter to application file.
Add the below parameters in the ,,setenv.sh file present in tomcat bin directory
JAVA_OPTS="$JAVA_OPTS -javaagent:/jmx_exporter/jmx_prometheus_javaagent-0.13.0.jar=19080:/jmx_exporter/tomcat.yaml"
export JAVA_OPTS
Step 4:- Adding the server parameters in the Prometheus.yml file
If You don’t know how to install Prometheus then follow this ,link.
Add the below parameters in prometheus.yml file
- job_name: 'Tomcat_Exporter'
    scrape_interval: 5s
    static_configs:
     - targets: ['Ip_address:19080']
save and exit
Restart the Prometheus server
Check the target in Prometheus http://ip_addressofprometheus:9090/targets
Step 5:- Import Jmx dashboard in grafana
Open Grafana dashboard http://ip_address:3000
If Grafana is not installed please follow this link to install ,Here.
Import the dashboard id: “10519” you will get all your Jmx metrics in grafana dashboard like below:
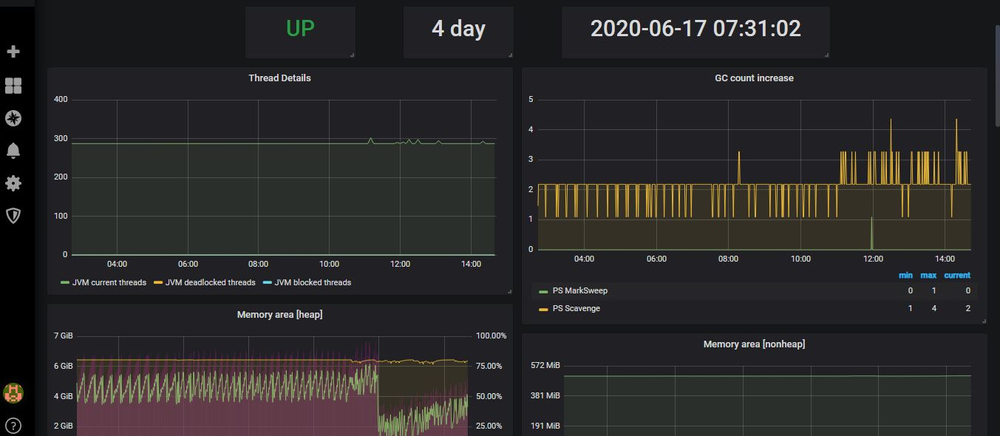
Congratulations... You follow all steps and set up JMX monitoring for your application.
For more content and updated please subscribe www.cloudsbaba.com
Reference:-
https://grafana.com/grafana/dashboards/10519
https://github.com/prometheus/jmx_exporter