

Grafana Loki is a set of components that can be composed into a fully featured logging stack.
Unlike other logging systems, Loki is built around the idea of only indexing metadata about your logs: labels (just like Prometheus labels). Log data itself is then compressed and stored in chunks in object stores such as S3 or GCS, or even locally on the file system. A small index and highly compressed chunks simplifies the operation and significantly lowers the cost of Loki.
Promtail: It is an agent which ships the contents of local logs to a private Loki instance . It is usually deployed to every machine that has applications needed to be monitored.
I am using the Loki Data Source with the Promtail client as the collector on the Grafana Server itself.
Steps we are going to perform in this article:
- Install and configure Loki Binary.
- Install and configure Promtail Binary.
- Configure Loki Data Source and Grafana.
Step 1: Install and configure Loki Binary.
Go to directory
cd /usr/local/binDownload the latest version of Loki from its official page.
sudo curl -O -L "https://github.com/grafana/loki/releases/download/v1.4.1/loki-linux-amd64.zip"
Unzip the Loki zip file
sudo unzip loki-linux-amd64.zip
Allow the executable permission to the Loki binary.
sudo chmod +x loki-linux-amd64
Create a Loki config file
sudo vi config-loki.ymlAdd this file in config-loki.yml
[pastacode lang=”bash” manual=”auth_enabled%3A%20false%20%0Aserver%3A%20http_listen_port%3A%203100%20%0Aingester%3A%20%0Alifecycler%3A%20%0Aaddress%3A%20127.0.0.1%20%0Aring%3A%20%0Akvstore%3A%0A%20store%3A%20%0Ainmemory%20replication_factor%3A%201%20%0Afinal_sleep%3A%200s%20%0Achunk_idle_period%3A%205m%20%0Achunk_retain_period%3A%2030s%20%0Aschema_config%3A%0A%20configs%3A%20%0A-%20from%3A%202018-04-15%20%0Astore%3A%20boltdb%0A%20object_store%3A%20filesystem%20%0Aschema%3A%20v9%20%0Aindex%3A%0A%20prefix%3A%20index_%20%0Aperiod%3A%20168h%20storage%0Astorage_config%3A%20%0Aboltdb%3A%20%0Adirectory%3A%20%2Ftmp%2Floki%2Findex%20%0Afilesystem%3A%20%0Adirectory%3A%20%2Ftmp%2Floki%2Fchunks%20%0Alimits_config%3A%0Aenforce_metric_name%3A%20false%20%0Areject_old_samples%3A%20true%20%0Areject_old_samples_max_age%3A%20168h%20chunk_store_config%3A%20%0Amax_look_back_period%3A%200%20%0Atable_manager%3A%0Achunk_tables_provisioning%3A%0A%20inactive_read_throughput%3A%200%0A%20inactive_write_throughput%3A%200%0A%20provisioned_read_throughput%3A%200%0A%20provisioned_write_throughput%3A%200%0A%20index_tables_provisioning%3A%0A%20inactive_read_throughput%3A%200%0A%20inactive_write_throughput%3A%200%0A%20provisioned_read_throughput%3A%200%0A%20provisioned_write_throughput%3A%200%20retention_deletes_enabled%3A%20false%0A%20retention_period%3A%200″ message=”” highlight=”” provider=”manual”/]
save and exit
Now Configure Loki as a service
sudo vi /etc/systemd/system/loki.service
Add the following
[Unit]
Description=Loki service
After=network.target

[Service]
Type=simple
ExecStart=/usr/local/bin/loki-linux-amd64 -config.file /usr/local/bin/config-loki.yml

[Install]
WantedBy=multi-user.target
save and exit
Start the service
systemctl start loki.service
systemctl enable loki.service
systemctl status loki.service

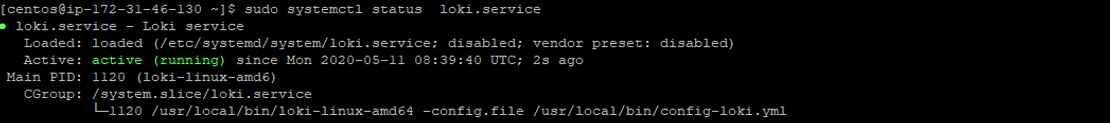
Open the browser and check if the URL is working or not
http://<IP_Address:3100/metrics>
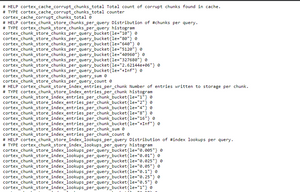
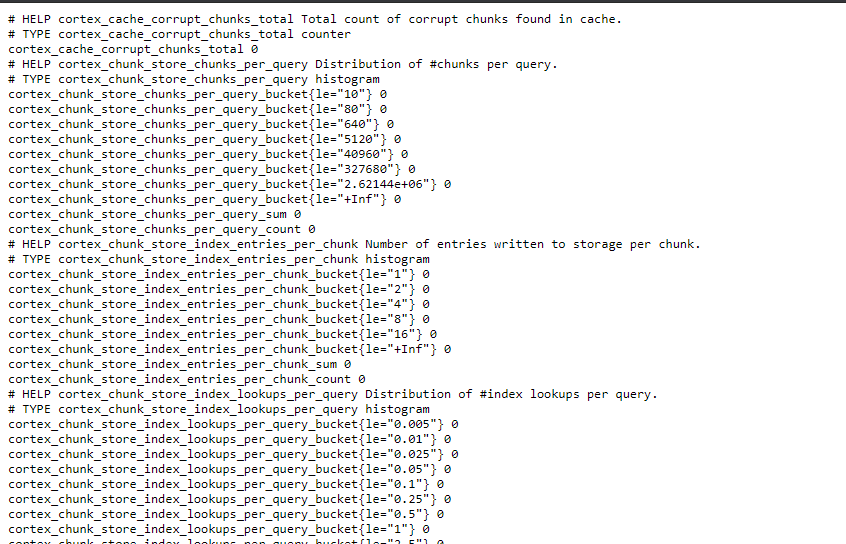
its working
Step 2: Install and configure Promtail Binary
In this article i am install and configure in other linux server .
go to directory
cd /usr/local/bin
Download the latest version of Promtail agent from official page.
sudo curl -O -L "https://github.com/grafana/loki/releases/download/v0.4.0/promtail-linux-amd64.gz"
unzip the promtail zip file
sudo gunzip promtail-linux-amd64.gz
Allow the executable permission to the Promtail binary.
sudo chmod +x promtail-linux-amd64
Create a promtail config file.
sudo vi config-promtail.yml
Add the following in config-promtail.yml
server:
  http_listen_port: 9080
  grpc_listen_port: 0

positions:
  filename: /tmp/positions.yaml

clients:
  - url: http://52.66.213.126:3100/loki/api/v1/push

scrape_configs:

  - job_name: system
    entry_parser: raw
    static_configs:
    - targets:
        - localhost
      labels:
        job: varlogs
        host: ip-172-31-43-74.ap-south-1.compute.internal
        __path__: /var/log/*log
save and exit
Create a service file for promtail
sudo vi /etc/systemd/system/promtail.service
Add the following script
[Unit]
Description=Promtail service
After=network.target

[Service]
Type=simple
ExecStart=/usr/local/bin/promtail-linux-amd64 -config.file /usr/local/bin/config-promtail.yml

[Install]
WantedBy=multi-user.target
exit and save
Start and check the service
sudo systemctl start promtail.service
sudo systemctl enable promtail.service
sudo systemctl status promtail.service
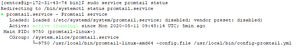
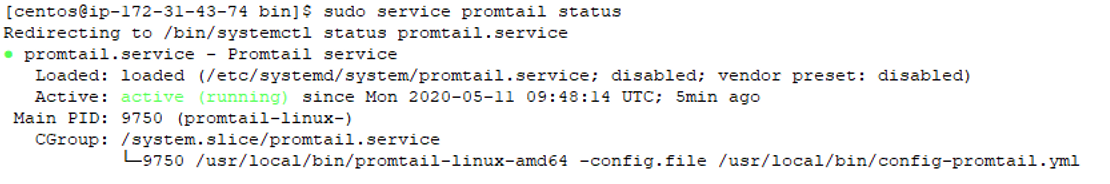
Open the browser and check if the URL is working or not
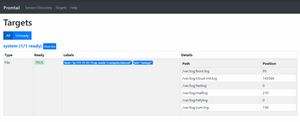
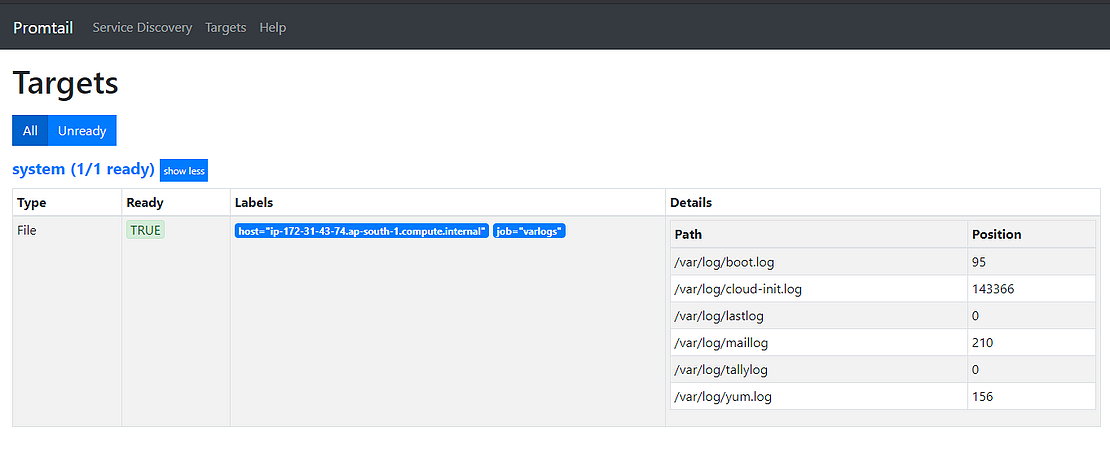
its working
Step 3: Configure Loki Data Source and Grafana.
For Grafana Installation please refer to this post:
Add data source in grafana
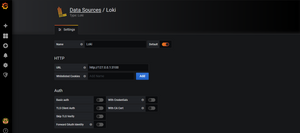
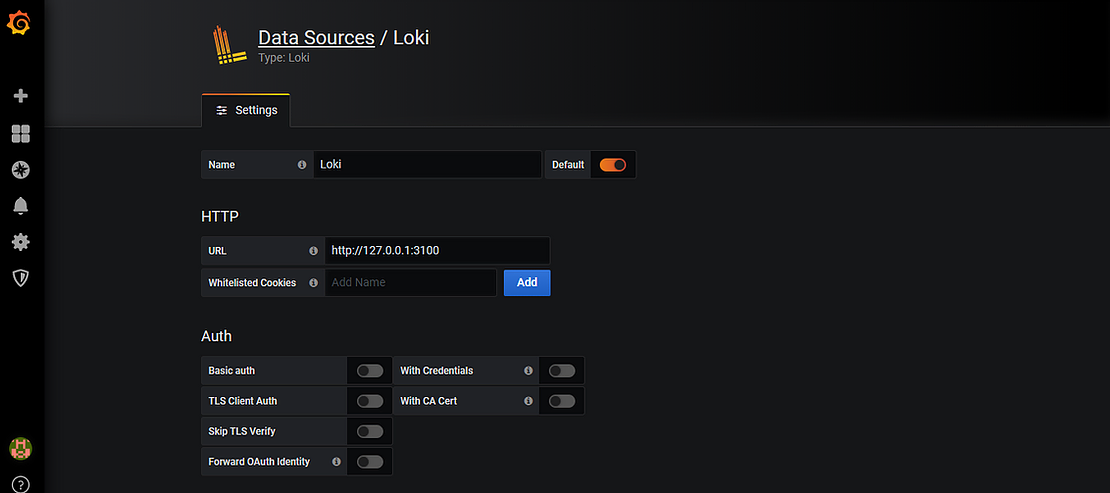
Save and test
Open Explorer
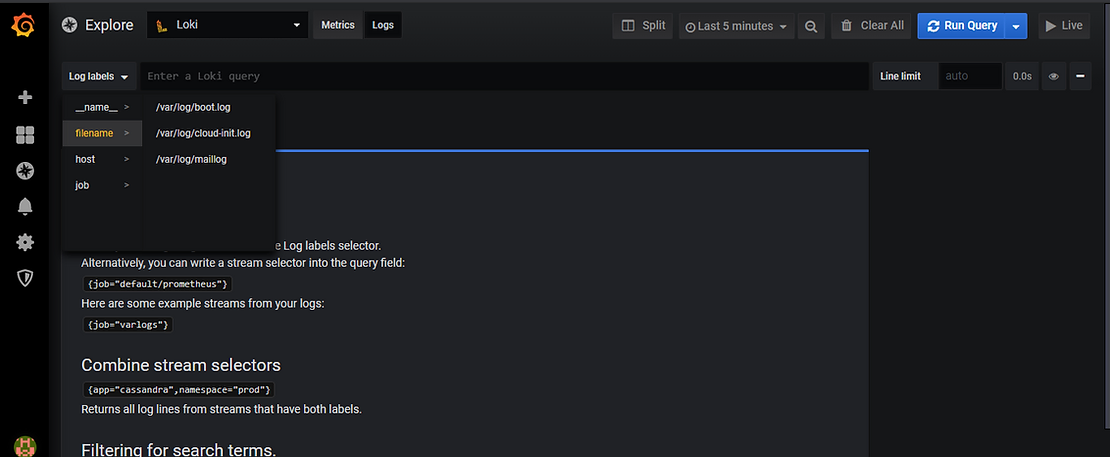
Drop down the Log labels tab and select file name/host/job as we defined in the promtail.yml file .
After selecting the filename you will able to see the logs
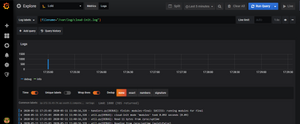
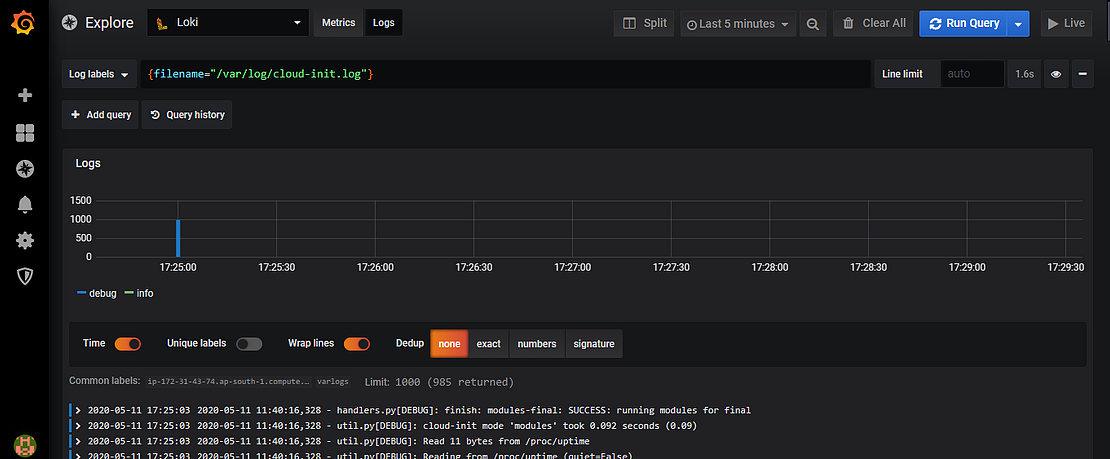
You can also search the logs according to your requirement.
Congratulations… You follow all the steps and configured log aggregation tool
Thank you…